Traffic analysis
In the statistics section, we have different pages that help us monitor the traffic. Main views explanation below.
Stats > Customer traffic > Overview
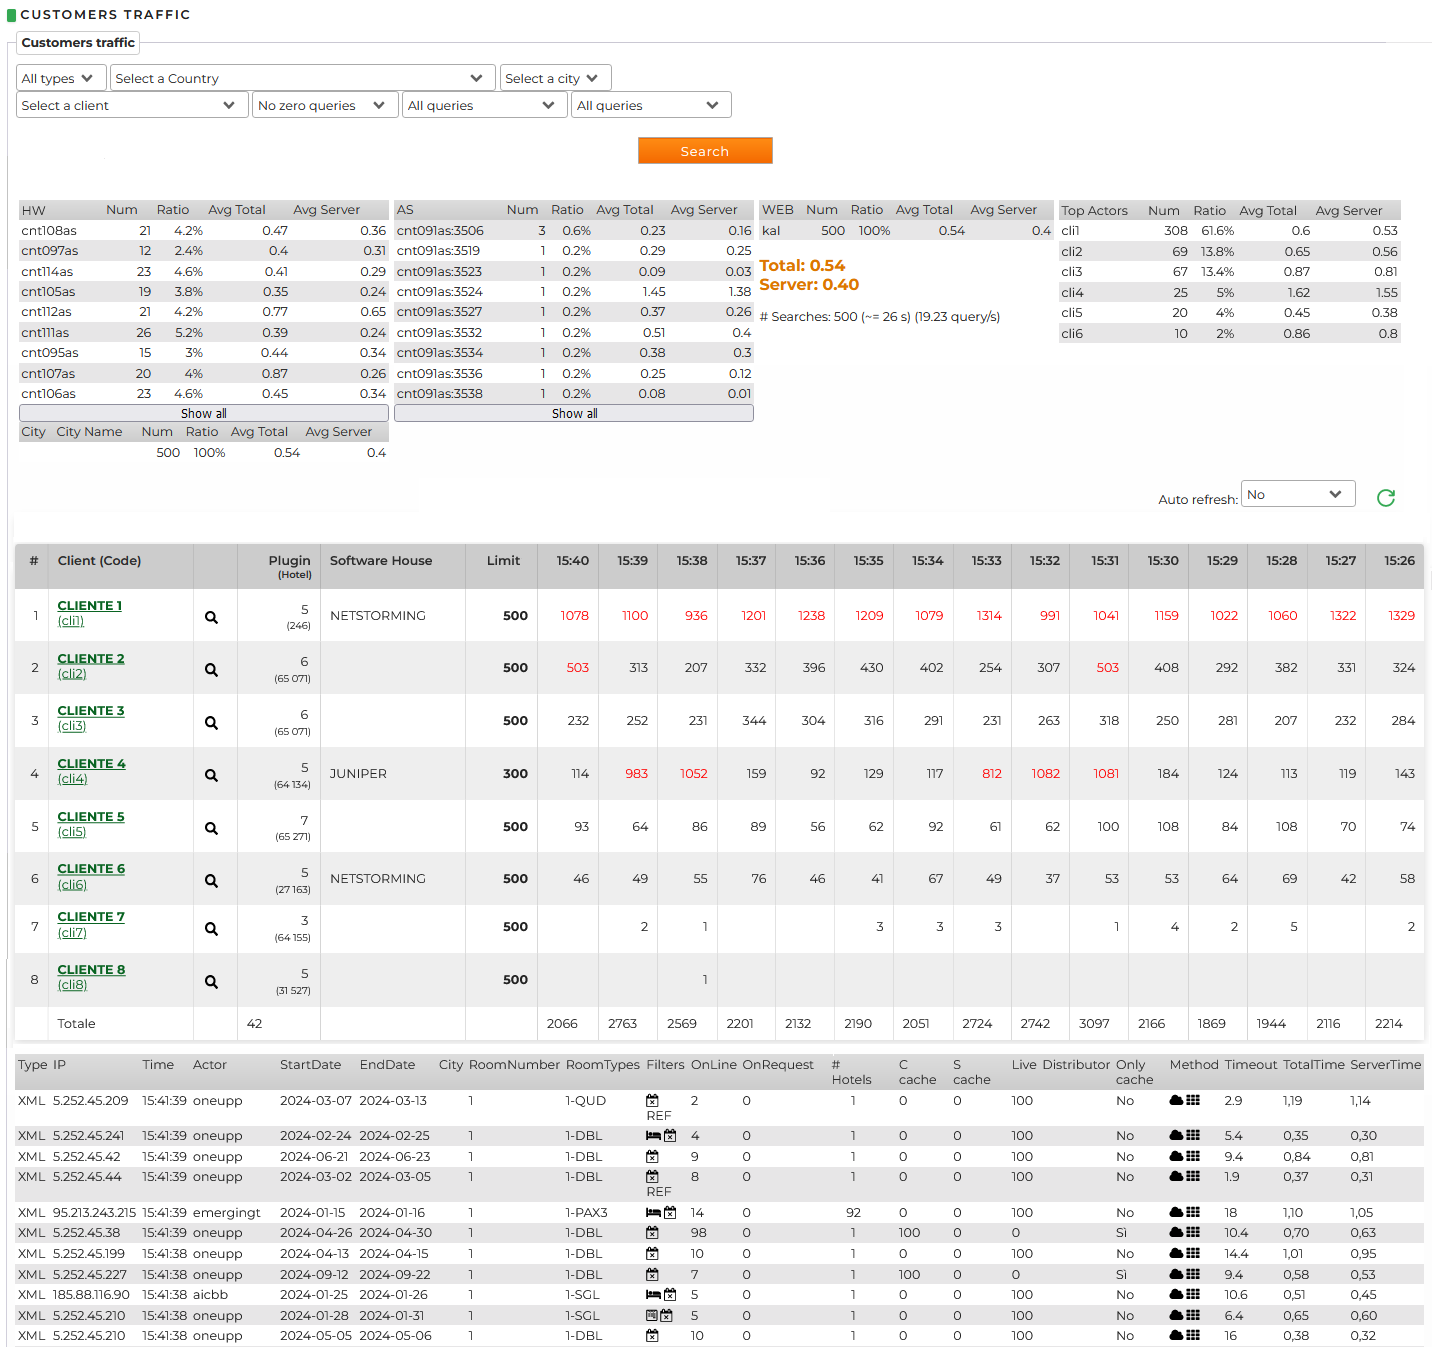
From this page screenshot it's possible to check in real time which clients are making traffic.
In the upper part, there are filters per client, zone, customer's name and type of search. Then, we have a summary of the average time of response.
It is also available a view for each single client with the numer of query per minute. If the data indicated is in color red, it means that the client sent a higher number of queries but have been cut by the system according the time limit set. Please note: the system cuts only the multi ID queries as usually the normal single IDs are preparatory to the booking phase and it is not advisable to cut them.
By clicking on the magnifying glass near the client's name, the system shows the reservations of that specific client divided for each supplier (it's possible to customize these intervals in the Customer's Profile> configuration tab, last item "Sales report intervals").
The third column shows the number of active suppliers and the number of the total hotels you provide to the client. By hovering the mouse over the number of plugins you can see which suppliers are configured and the related mark up set.
In the last part of the page, we can verify query by query, analyzing the following details:
- IP: IP address from where the request is coming
- Time: time of the request
- Actor: client's code from where the request is coming
- StartDate: checkin date set in the research
- EndDate: checkout date set in the research
- City: Requested city. NOTE: most of the clients nowadays, don't send the request per city but per multi ID.
- RoomNumber: number of rooms requested
- RoomTypes: type of room requested
- Filters: the filters applied during the search phase
- # OnLine: number of solutions with Immediate Confirmation
- # OnRequest: number of solutions On Request
- # Hotels: number of hotels requested in multi ID (if only 1, it means that the query was made on single ID)
- C chache: percentage of results chached on client's side
- S chache: percentage of results chached on supplier's side (always 0 as never use)
- Live: percentage of results not chached
- Distributor: customer distribution channel, used only in specific situations
- Only cache: if yes, it means that all results were served by the cache
- Method: type of availability made (used mainly by the Netstorming's staff)
- Timeout: timeout requested by the client. Wins in the order: 1) what passed through xml from the client 2) what set in the customer's profile 3) the default in the customer's profile
- TotalTime: the total time taken to respond to the request (server time + result aggregation results)
- ServerTime: processing time for supplier's response
Stats> Customer traffic > per Period (days)
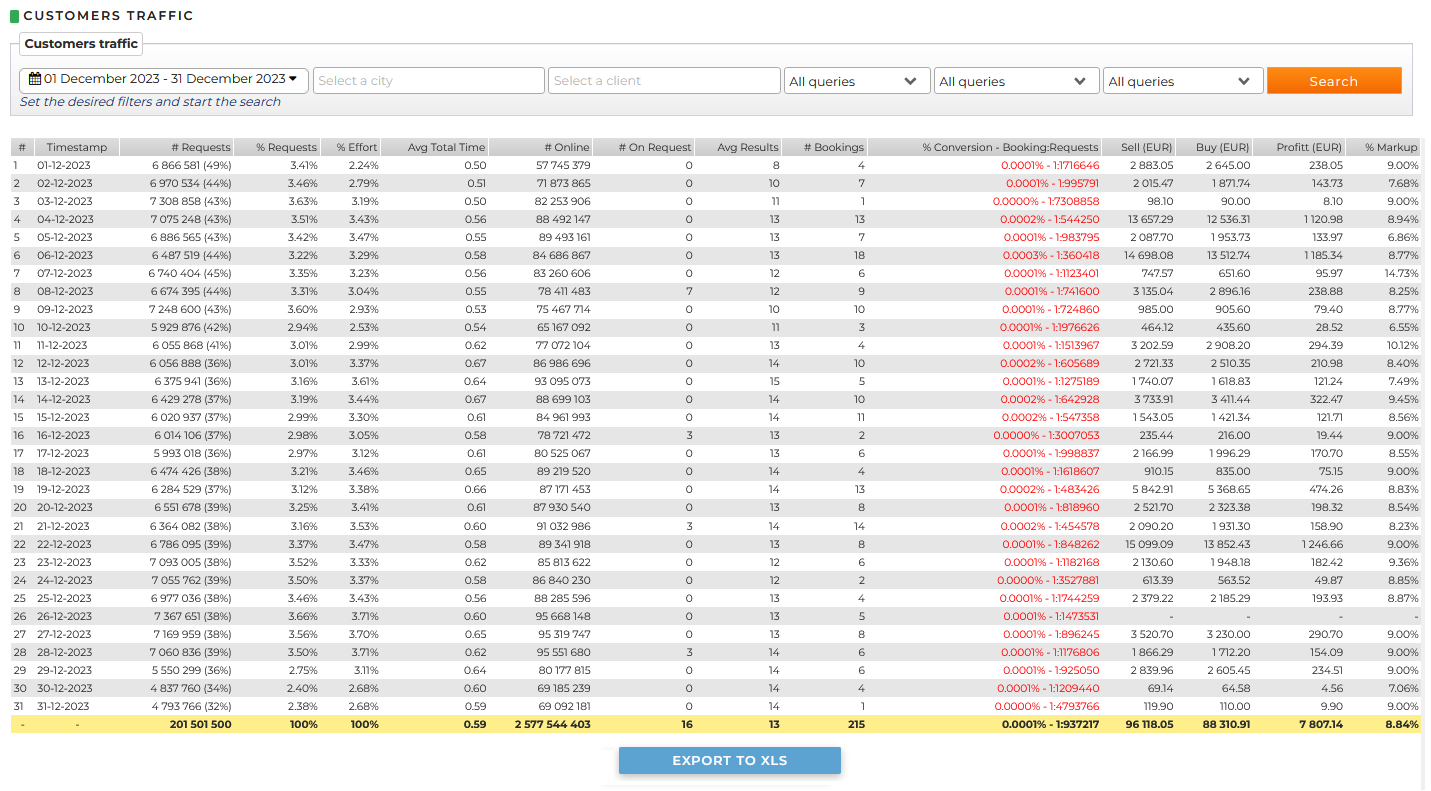
In this page you can check the traffic generated from the system for a specific period.
In the upper part, you can find the filters per period, city, client and type of search.
Among the results, we can analyze:
- Timestamp reference date
- # Requests total number of requests received. The number between the parentheses indicates the query percentage
- % Requests percentage of requests compared to the total
- % Effort percentage of the system usage for specific requests (based on the number of hotels per request)
- Avg Total Time: average response time
- # Online: number of solutions with Immediate Confirmation
- # OnRequest: number of solutions On Request
- Avg Results: average number of hotel's returned per request
- # Bookings: number of the reservations
- % Conversion - Booking:Requests: indicate the L2B, the relationship between the requests and the reservations received
- Sell (EUR): gross selling price
- Buy (EUR): net sales price
- Profit (EUR): operating profit
- % Markup: margin on sales
Stats> Customer Traffic> per Day (clients)
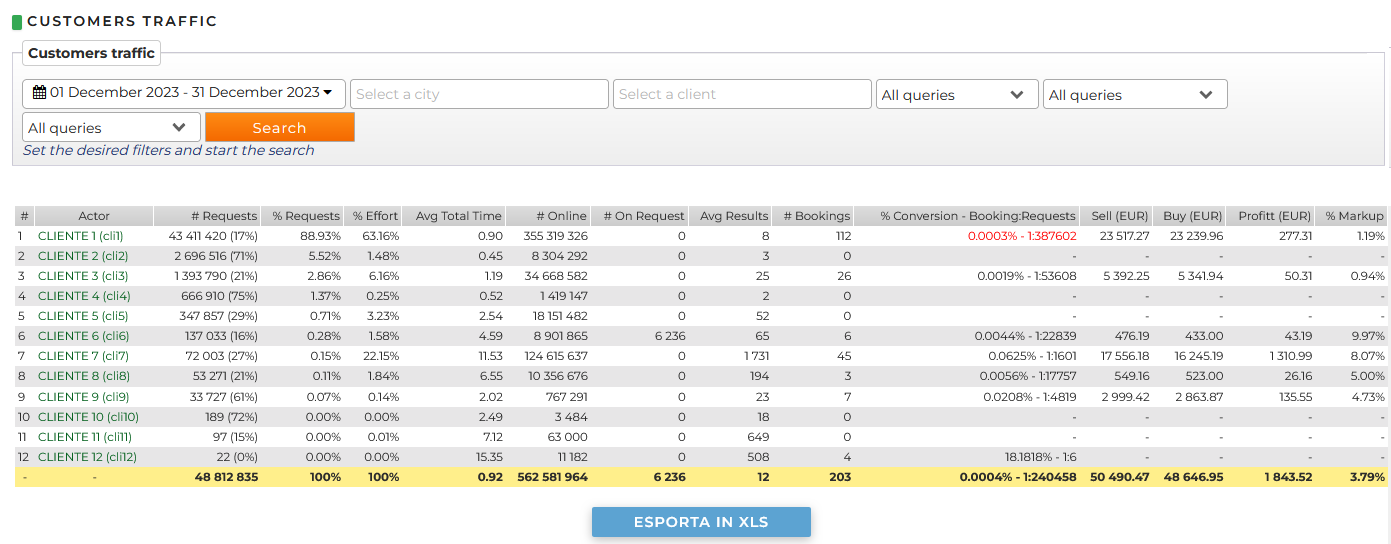
In this page we can analyze the data with a view divided per client. This statistics is useful to understand which clients requires the optimization described previously.