Client Traffic analysis
Several sections in Stats > Customer traffic are useful for keeping track of traffic. Among the most important:
API Overview
There will be several sections:
1. AVAILABILITY SEARCHES
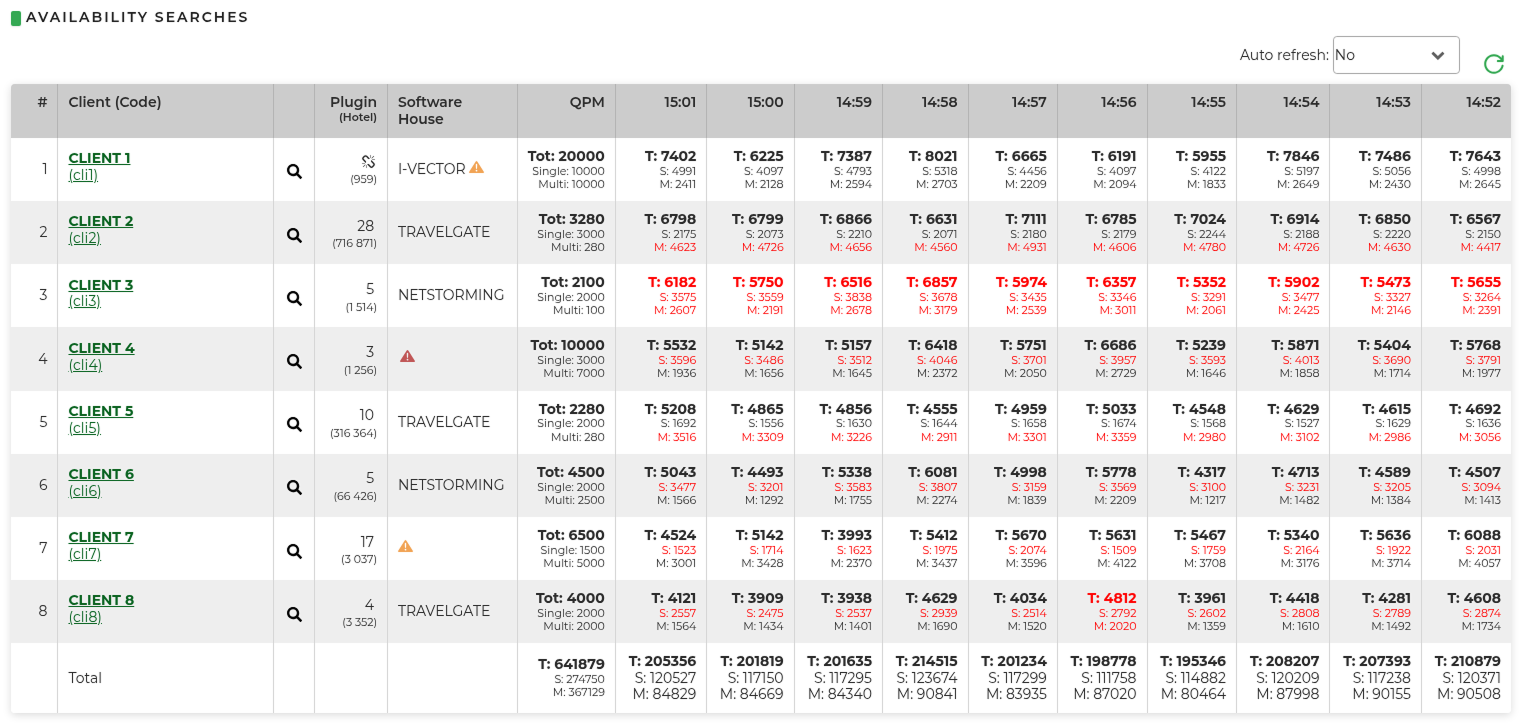
From here it's possible to check in real time which clients are making traffic.
There is a view for each single client with the numer of query per minute divided in:
- S: Single queries
- M: Multi queries
- T: Total queries If the data indicated is in color red, it means that the client sent a higher number of queries but have been cut by the system according the time limit set.
By clicking on the magnifying glass near the client's name, the system shows the reservations of that specific client divided for each supplier (it's possible to customize these intervals in the Customer's Profile> configuration tab, last item "Sales report intervals").
The third column shows the number of active suppliers and the number of the total hotels you provide to the client. By hovering the mouse over the number of plugins you can see which suppliers are configured and the related mark up set.
Please note: enter the name of the software house where it is not already provided. It's settable at the bottom of the existing Customer Profile through the button Sofwtare House.
Icons:
- broken link: you are not querying third-party suppliers but only your own direct product. “noxml” filter is selected in the Limitations tab of the Customer Profile

- red warning: all ip's are blocked. It isn't selected “Allow ANY IP address” in the Web Services tab of the Customer Profile, so you need to define them in this section
 NOTE: if a Client uses the Netstorming platform, it is sufficient to select only the Software House, as mentioned previously
 - yellow warning: all ip's are allowed. It is selected “Allow ANY IP address” in the Web Services tab of the Customer Profile, it is recommended to define them in this section for increased security

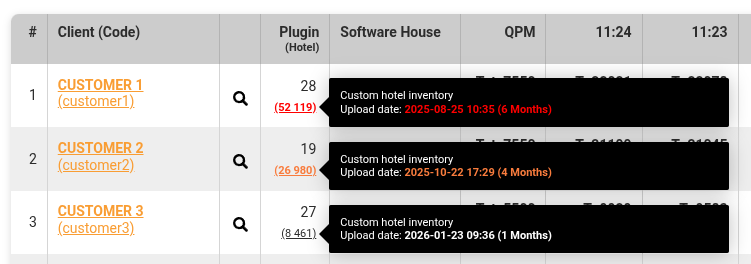
In the case of uploading a Custom Hotel Inventory, the number in parentheses in the "Plugin (Hotels)" column will be underlined and, when hovering over it, an informational pop-up will appear:
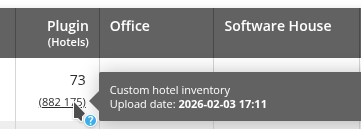
This number will be red if the upload occurred more than 6 months ago, yellow/orange if it occurred between 3 and 6 months ago, and uncolored if it occurred less than 3 months ago; when hovering over it, an informational pop-up will appear:
2. EVALUATE
Section where prebook clients are reported.
3. CLIENTS WITHOUT WS
Section visible only if there are clients with closed web services.
Customer sales report
Clicking on the magnifying glass icon next to the customer allows you to view details of their sales report; specifically, the percentage of rejected bookings is indicated through the following colors:
- green: less than or equal to 10%
- yellow: less than or equal to 20%
- orange: less than or equal to 40%
- red: greater than 40%
Today's Queries (real time)
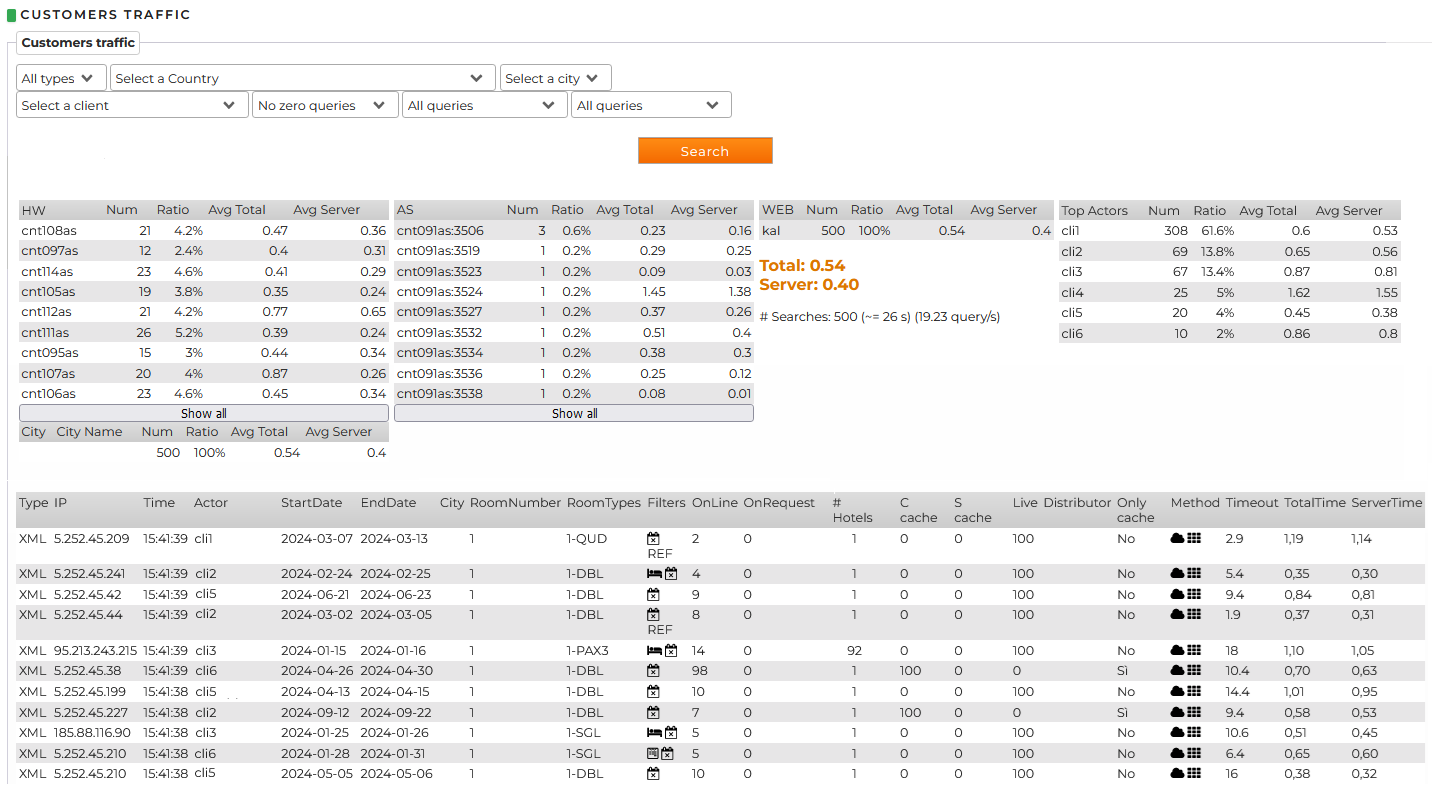
In the upper part, there are filters per client, zone, customer's name and type of search. Then, we have a summary of the average time of response.
In the last part of the page, we can verify query by query, analyzing the following details:
- IP: IP address from where the request is coming
- Time: time of the request
- Actor: client's code from where the request is coming
- StartDate: checkin date set in the research
- EndDate: checkout date set in the research
- City: Requested city. NOTE: most of the clients nowadays, don't send the request per city but per multi ID.
- RoomNumber: number of rooms requested
- RoomTypes: type of room requested
- Filters: the filters applied during the search phase
- # OnLine: number of solutions with Immediate Confirmation
- # OnRequest: number of solutions On Request
- # Hotels: number of hotels requested in multi ID (if only 1, it means that the query was made on single ID)
- C chache: percentage of results chached on client's side
- S chache: percentage of results chached on supplier's side (always 0 as never use)
- Live: percentage of results not chached
- Distributor: customer distribution channel, used only in specific situations
- Only cache: if yes, it means that all results were served by the cache
- Method: type of availability made (used mainly by the Netstorming's staff)
- Timeout: timeout requested by the client. Wins in the order: 1) what passed through xml from the client 2) what set in the customer's profile 3) the default in the customer's profile
- TotalTime: the total time taken to respond to the request (server time + result aggregation results)
- ServerTime: processing time for supplier's response
By Day (Clients)
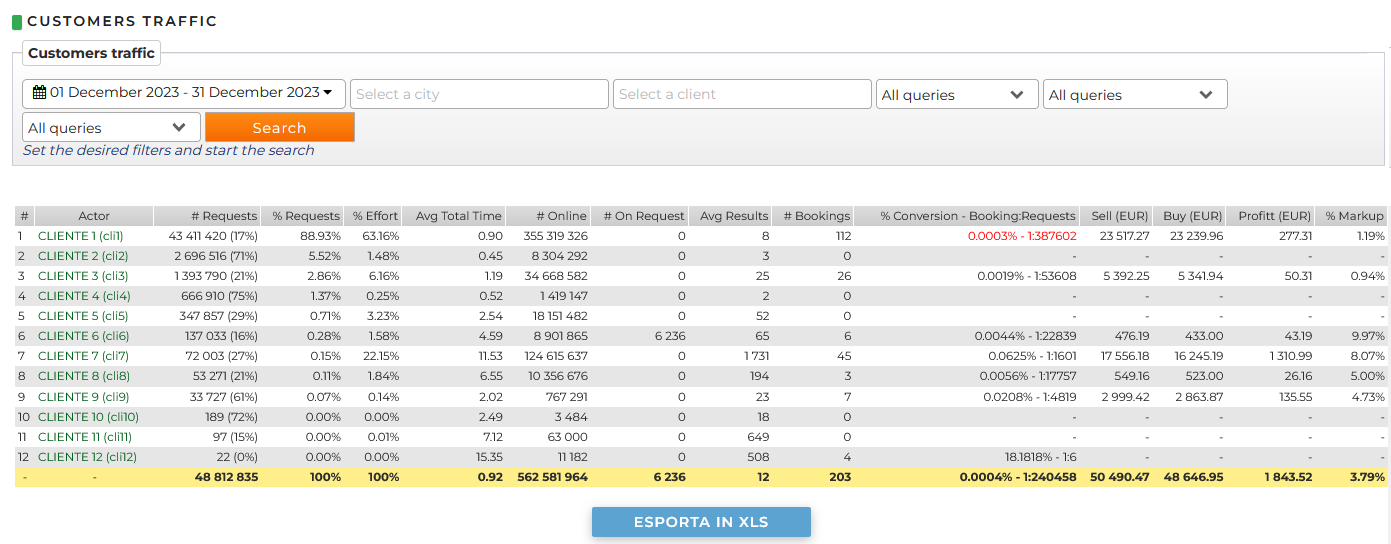
In this page we can analyze the data with a view divided per client. This statistics is useful to understand which clients requires the optimization described previously.
-
The column with the heading # request shows the number of requests, in brackets how many of these were not granted availability
-
The column with the heading % request shows the percentage of requests made by that customer out of the total requests
- The column with the heading % effort shows the percentage of "customer success"
Example: CUSTOMER 6 makes 137033 queries, of these 16% do not produce availability, the remaining 84% have obtained availability instead and this 84% compared to the availability obtained by the other customers is 1.58% effort
In this page we can analyze the data with a view divided per client. This statistics is useful to understand which clients requires the optimization described previously.
Section statistics per period: Stats> Customer traffic > per Period (days)
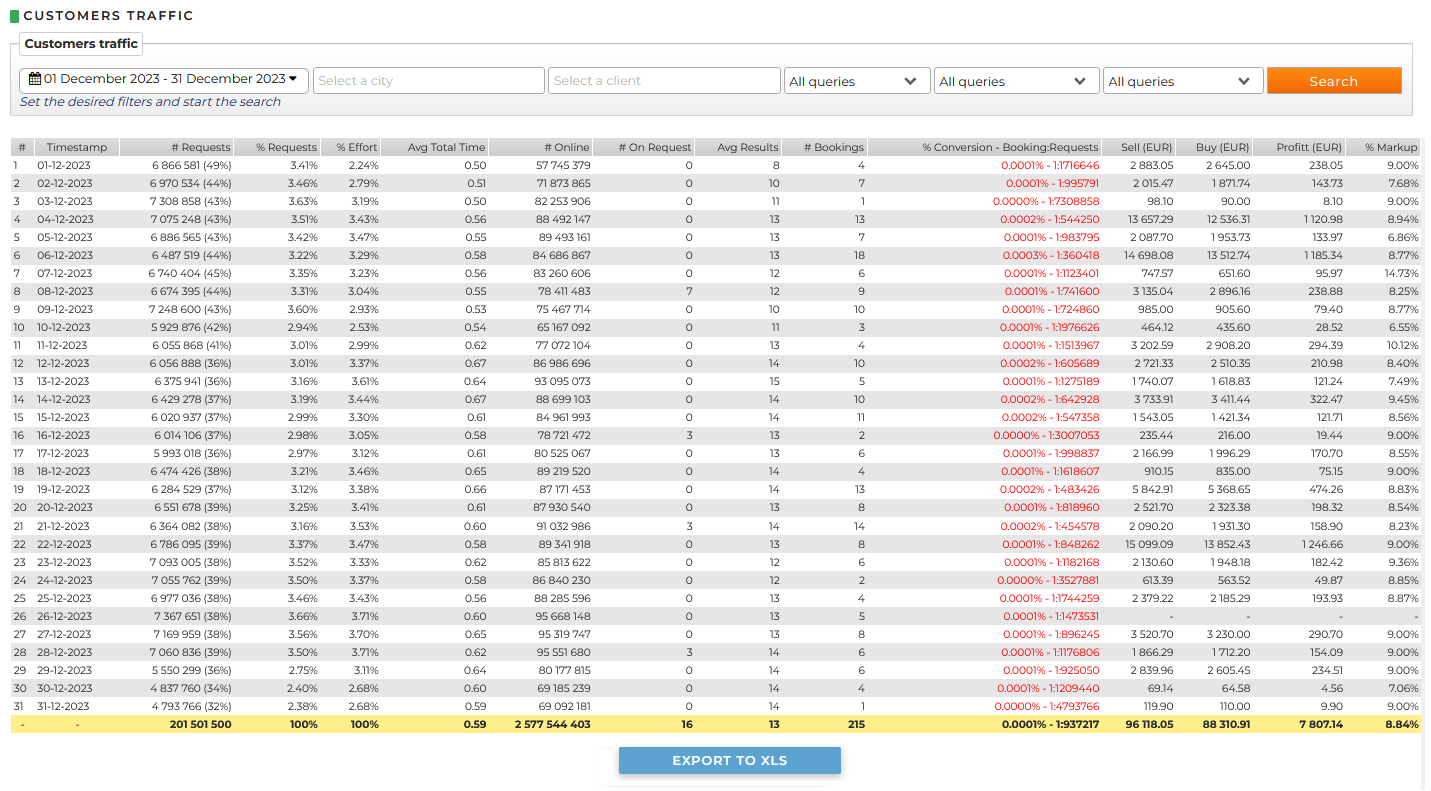
In this page you can check the traffic generated from the system for a specific period.
In the upper part, you can find the filters per period, city, client and type of search.
Among the results, we can analyze:
- Timestamp reference date
- # Requests total number of requests received. The number between the parentheses indicates the query percentage
- % Requests percentage of requests compared to the total
- % Effort percentage of the system usage for specific requests (based on the number of hotels per request)
- Avg Total Time: average response time
- # Online: number of solutions with Immediate Confirmation
- # OnRequest: number of solutions On Request
- Avg Results: average number of hotel's returned per request
- # Bookings: number of the reservations
- % Conversion - Booking:Requests: indicate the L2B, the relationship between the requests and the reservations received
- Sell (EUR): gross selling price
- Buy (EUR): net sales price
- Profit (EUR): operating profit
- % Markup: margin on sales